2/9/26 — Segmented Chart Export
Export segmented quantitative charts from the reports dashboard for use in presentations and external analysis.
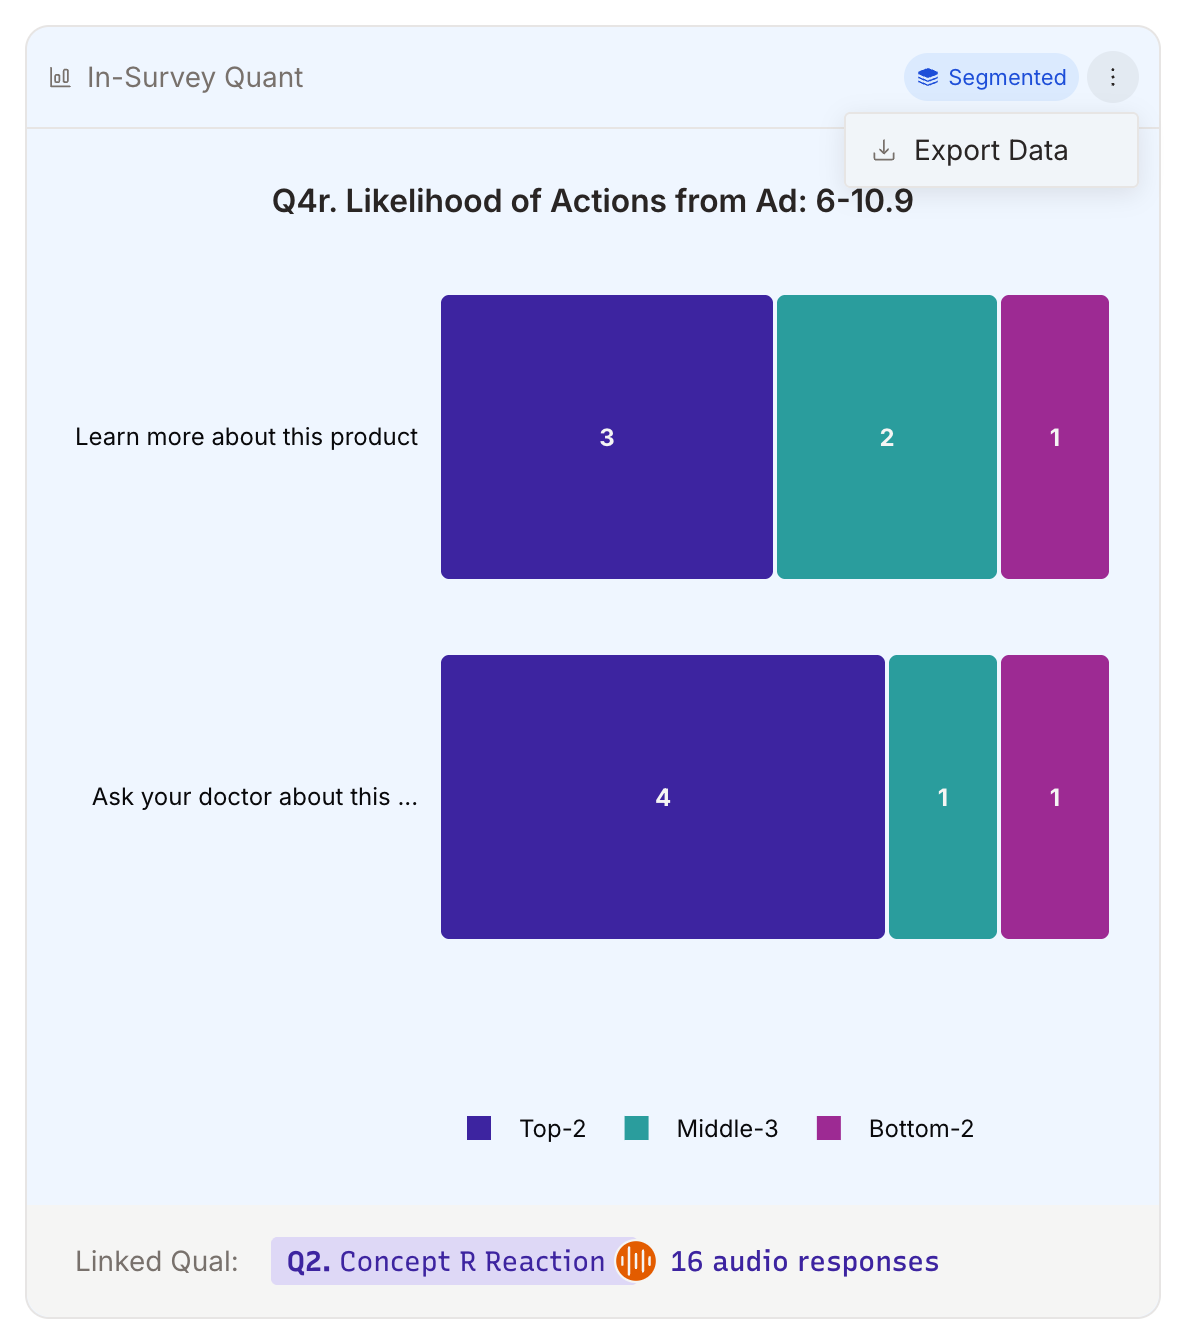
Building on the Quantitative Data Segmentation feature released in January, you can now export segmented charts directly from the reports dashboard.
What’s New
When you’ve applied segment groups to your quantitative questions, the resulting filtered charts can now be exported for use in presentations, client deliverables, or external analysis tools. Each segmented chart exports with its filter context intact, so you know exactly which participant group the data represents.
Key Features
- Segmented Chart Export: Download any segmented chart view from the reports dashboard
- Filter Context Preserved: Exported data includes the segment group and filter criteria
- Works with All Segments: Compatible with any segment groups you’ve created
Why It Matters
Segmentation is most valuable when the insights reach stakeholders beyond the platform. Exporting segmented charts lets you incorporate filtered comparisons directly into presentations and reports, maintaining the specificity of your analysis when sharing results with clients and colleagues.
Learn More
To learn how to create segments, see the Quantitative Data Segmentation release note. For more on working with your data, see our Exploring Responses guide.