1/22/26 — Quantitative Data Segmentation
Segment your quantitative data by screener and survey questions to uncover differences across participant groups.
Quantitative analysis just got significantly more powerful. You can now segment screener and quantitative questions by other screener or quantitative questions, making it easy to compare how different participant groups responded across your study.
How It Works
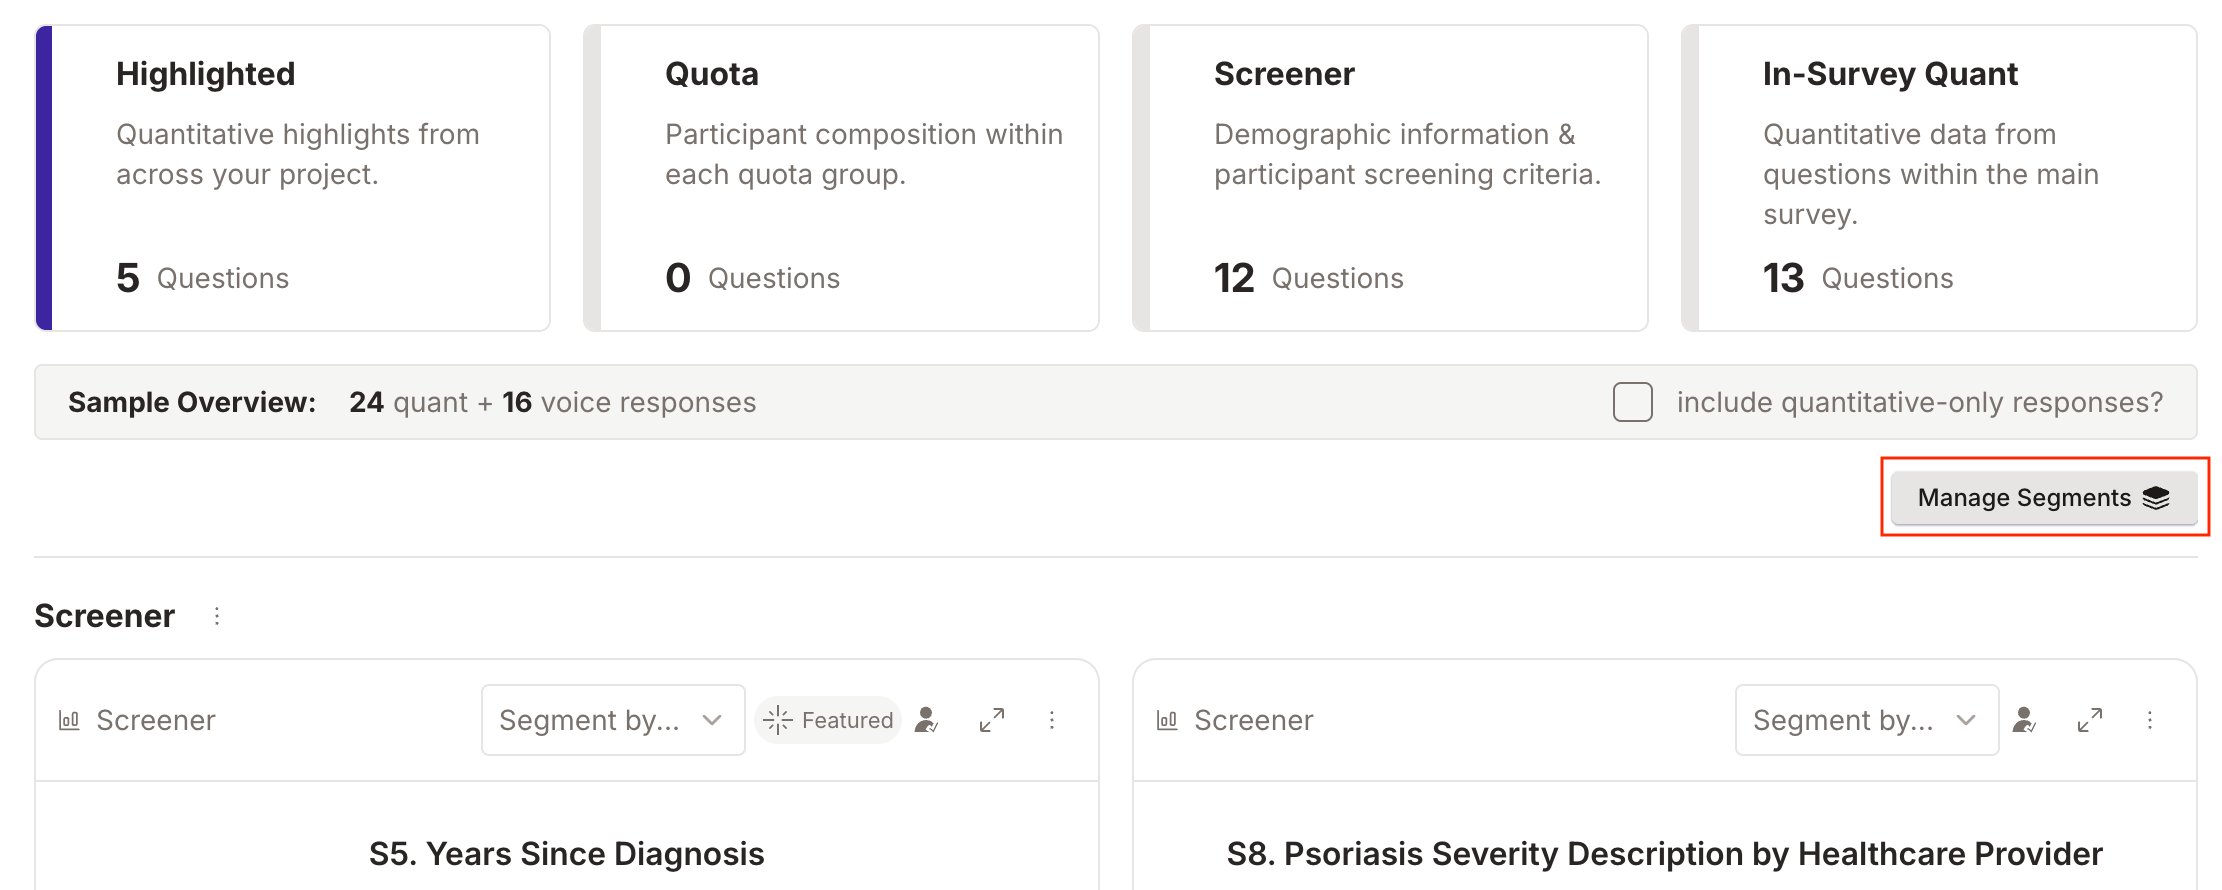
Click the new Manage Segments button on any quantitative question to get started. From there, you’ll create segment groups — named collections of filters that get applied together.
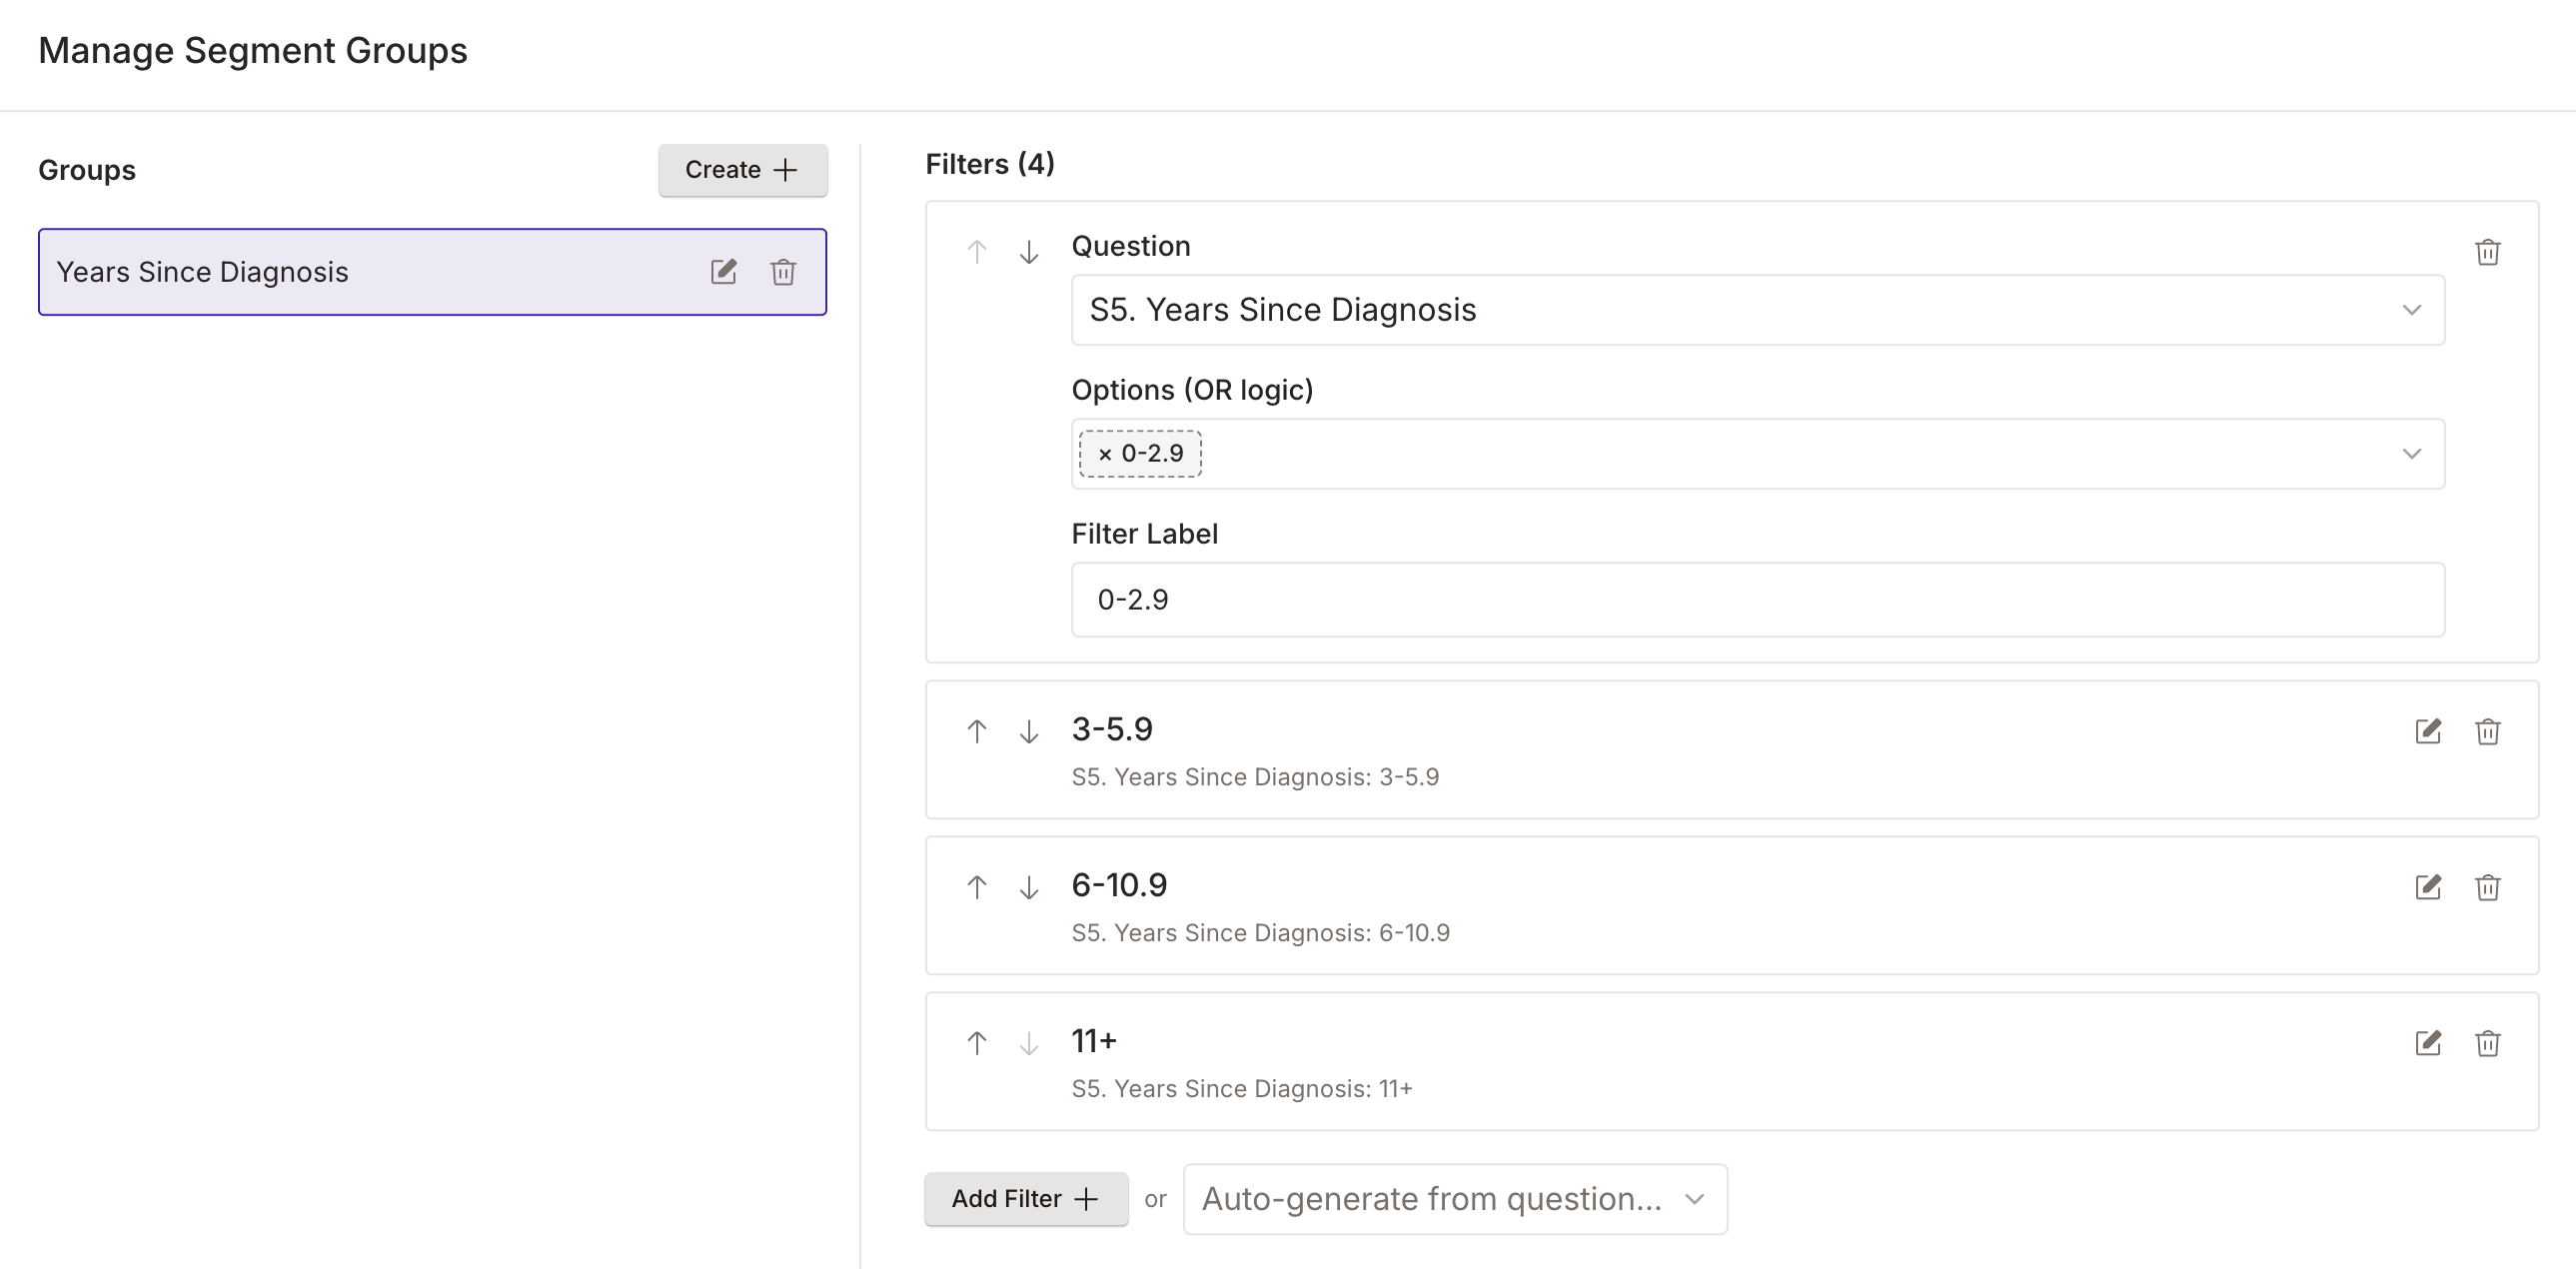
Creating Segment Groups
- Create a group — Give it a meaningful name that describes the comparison you’re making
- Add filters — Select a screener or quantitative question, then choose one or more response options to filter by
- Set comparison values — For ranked questions, filter by ranking position (e.g., only participants who ranked an option first). For free-text questions, filter by specific values entered
- Customize labels — Adjust filter labels to keep your analysis clear and readable
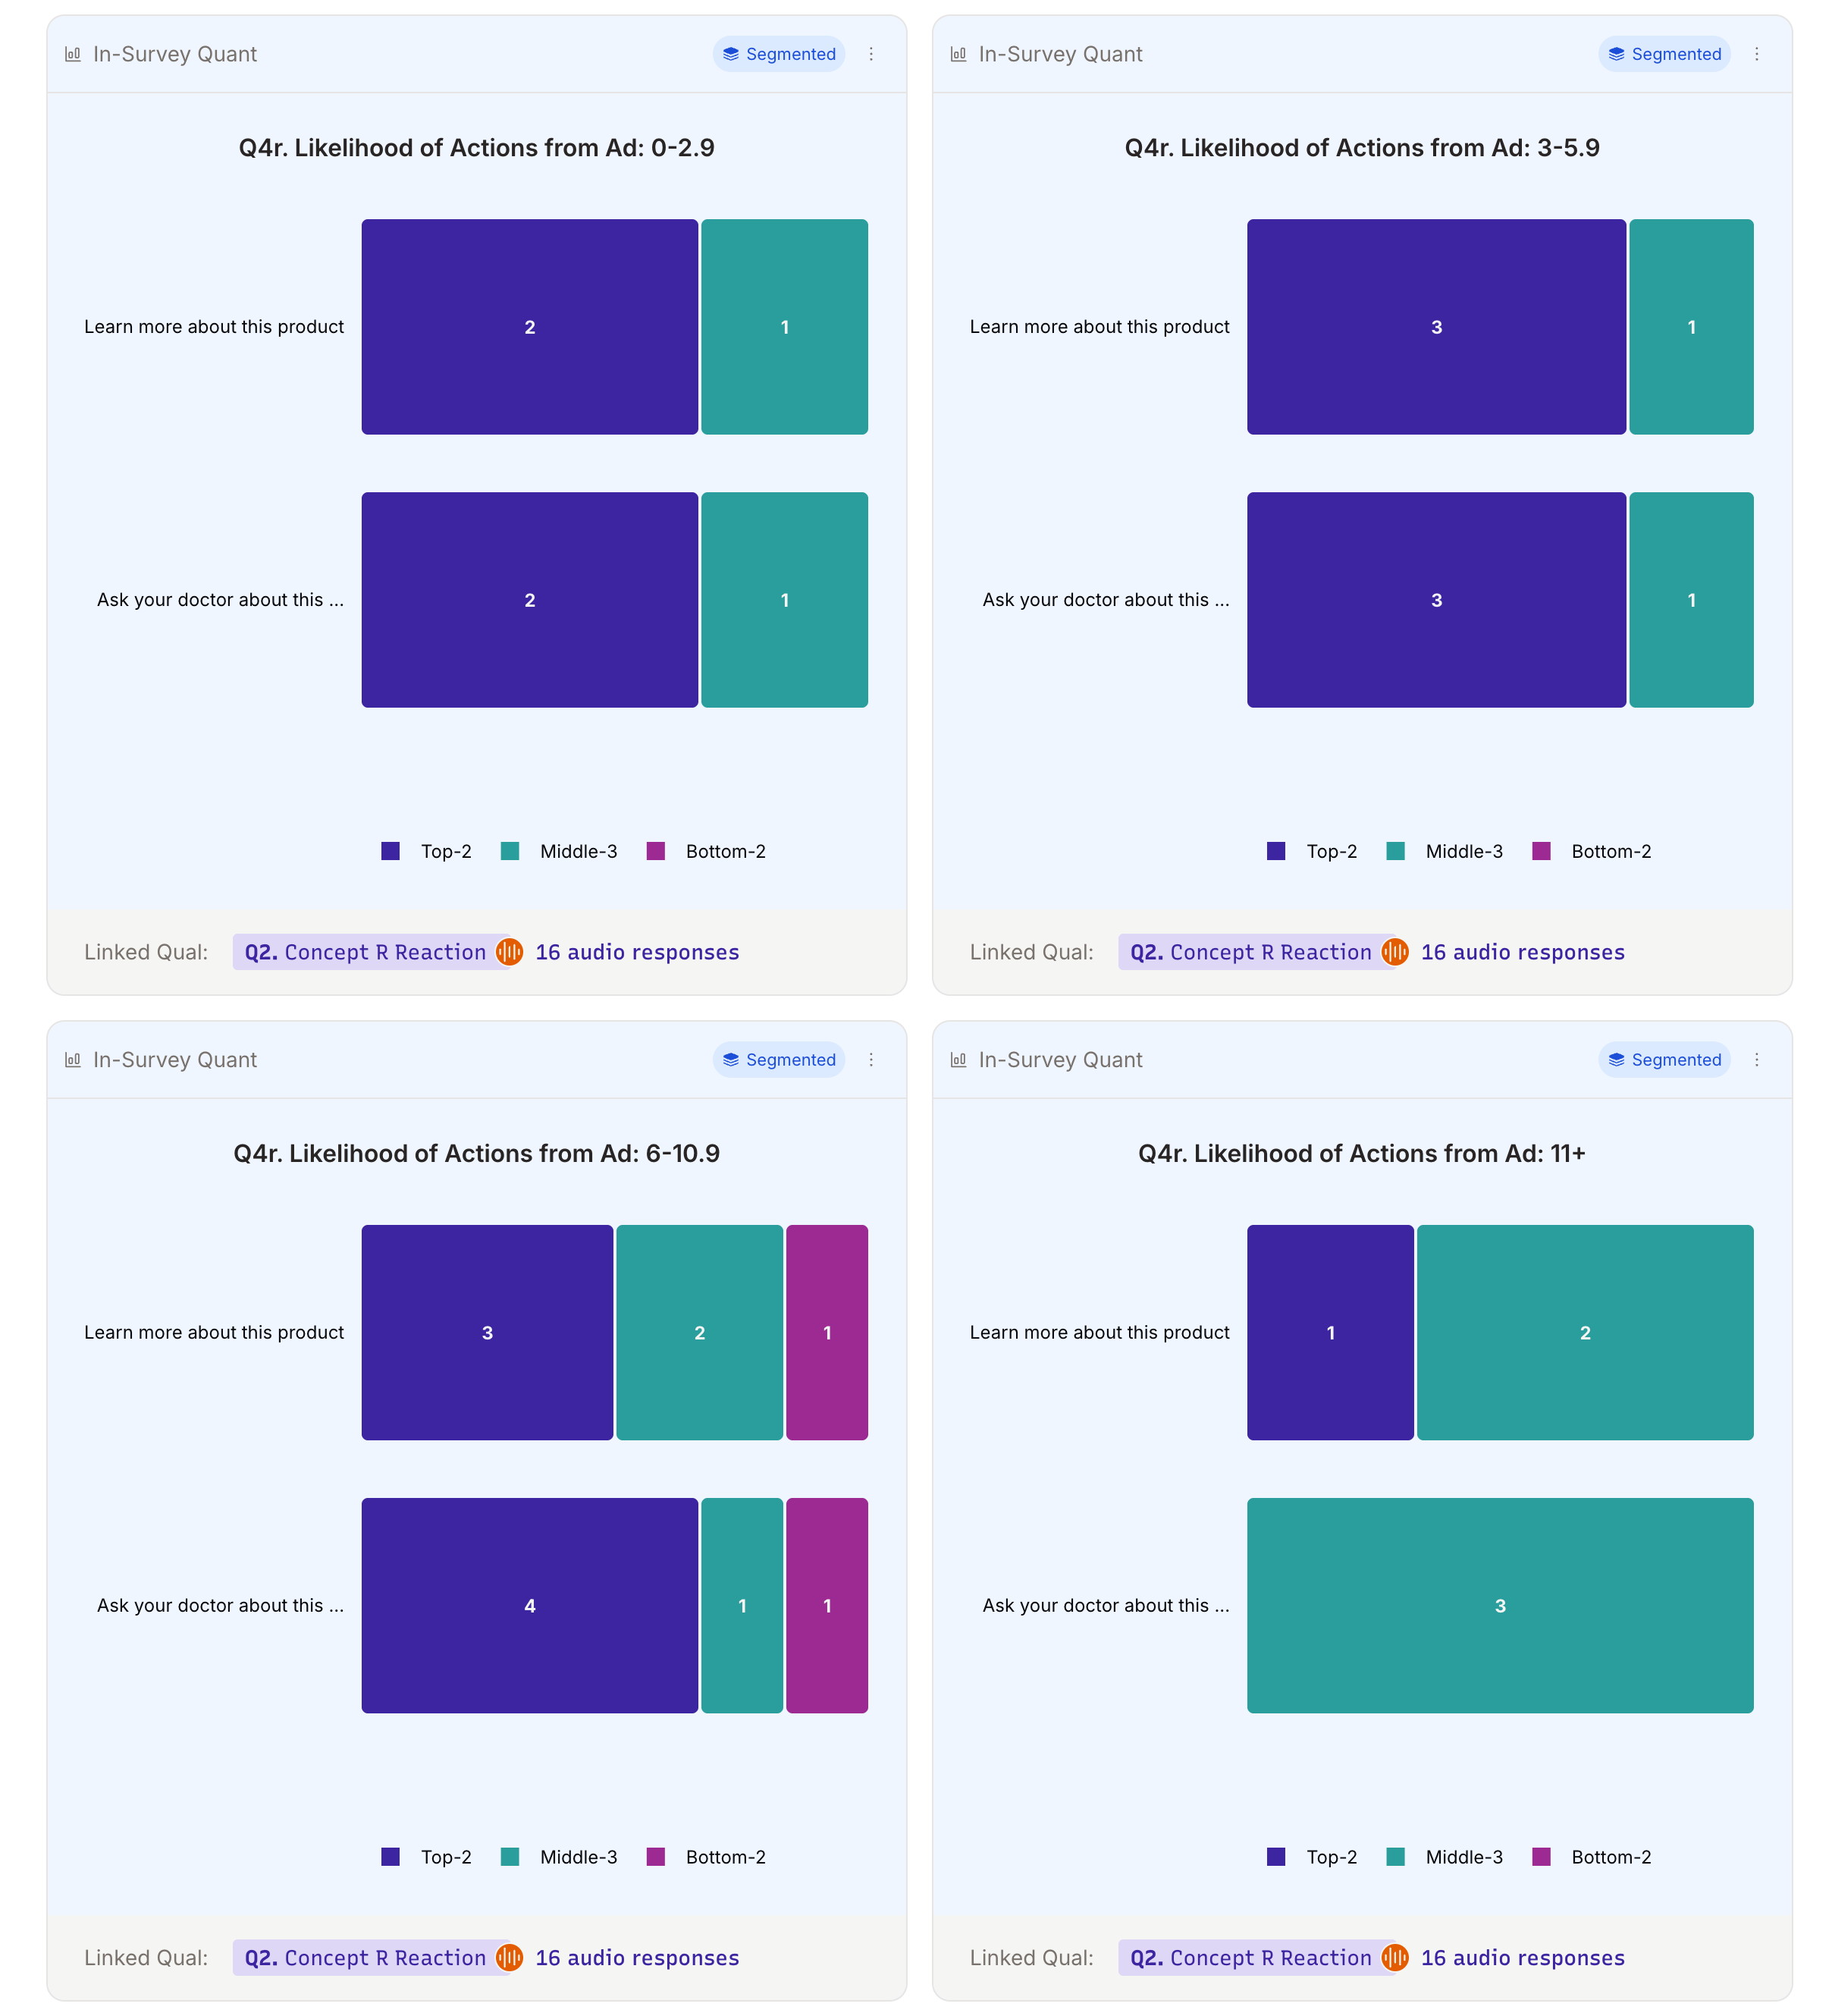
Viewing Segmented Results
Once a segment group is created, select it from the Segment by… dropdown on any quantitative question. The platform generates a chart for each filter in the group, showing only the respondent data that matches that filter’s criteria.
If no respondents match a particular filter, you’ll see a clear “No respondents match this filter” message rather than an empty chart.
Key Features
- Segment Groups: Organize multiple related filters under a single named group
- Multi-Question Filtering: Filter by any combination of screener and quantitative questions
- Comparison Values: Target specific ranking positions or respondent-entered values
- Custom Labels: Rename filters for clarity in your analysis
- Automatic Chart Generation: Each filter produces its own chart for side-by-side comparison
Why It Matters
Until now, viewing quantitative data meant looking at aggregate responses across all participants. Segmentation lets you ask more targeted questions: How did participants who rated efficacy highly differ in their safety perceptions? Do patients on a specific therapy respond differently to satisfaction questions? These cross-cutting comparisons turn quantitative data into actionable insights.
Learn More
To explore more ways to analyze your research data, see our Exploring Responses guide.